|
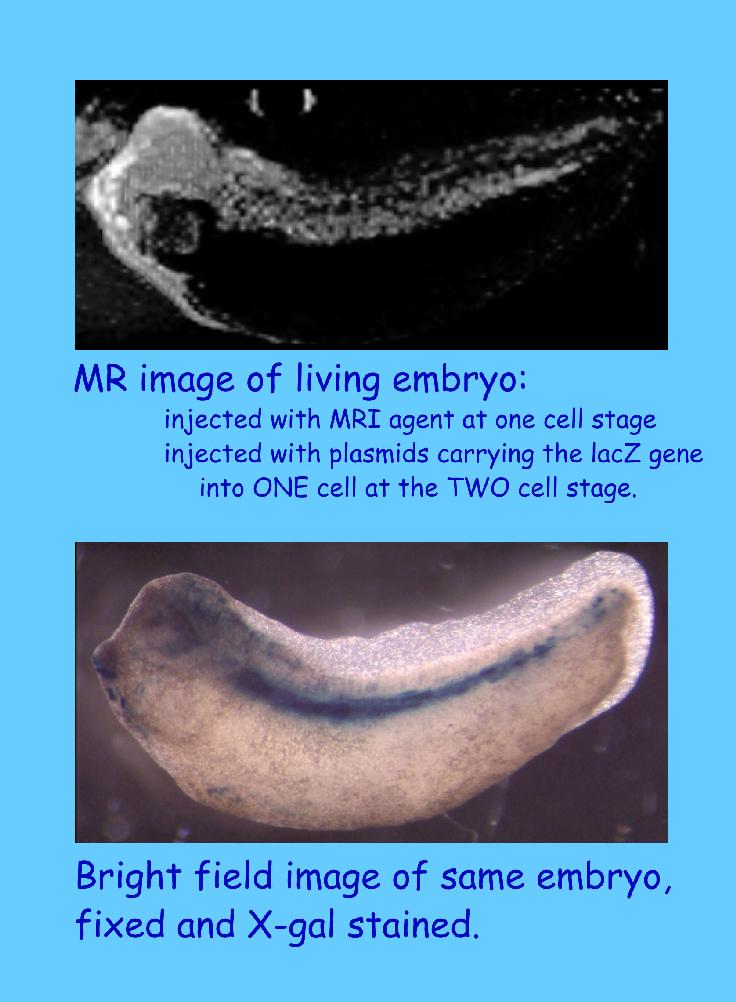
MRI_plasmid.jpg 76.84 Kb 736 x 1002 |
Using MRI to see gene expression patterns in vivo |
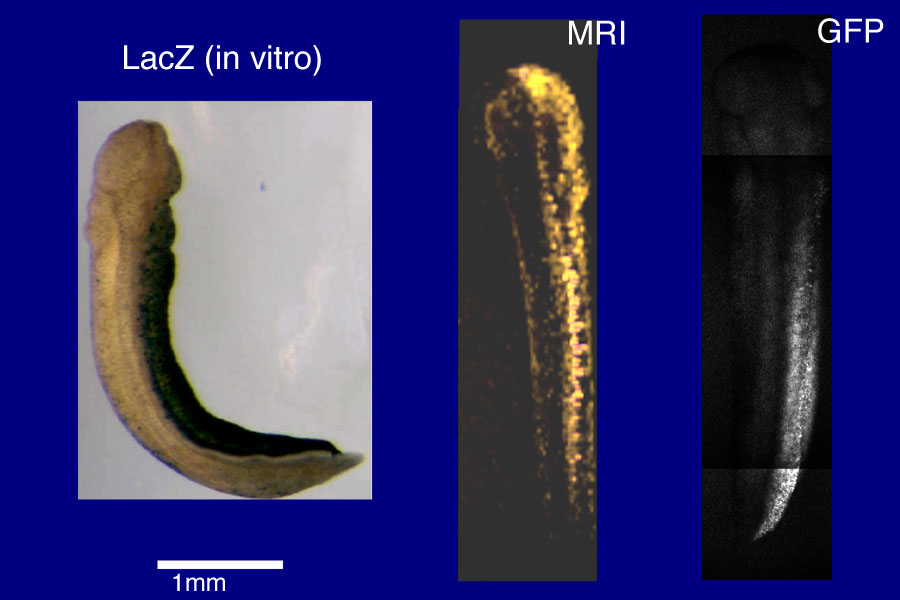
fl_mr_lacZ.jpg 69.74 Kb 900 x 600 |
Three ways to access gene expression patterns: fluorscence microscopy (in vivo), MRI microscopy (in vivo), and histologically (in vitro) |
MR_mouse.gif 2.79 Kb 1280 x 838 |
Volume renderings of MR images of fixed mouse embryos |
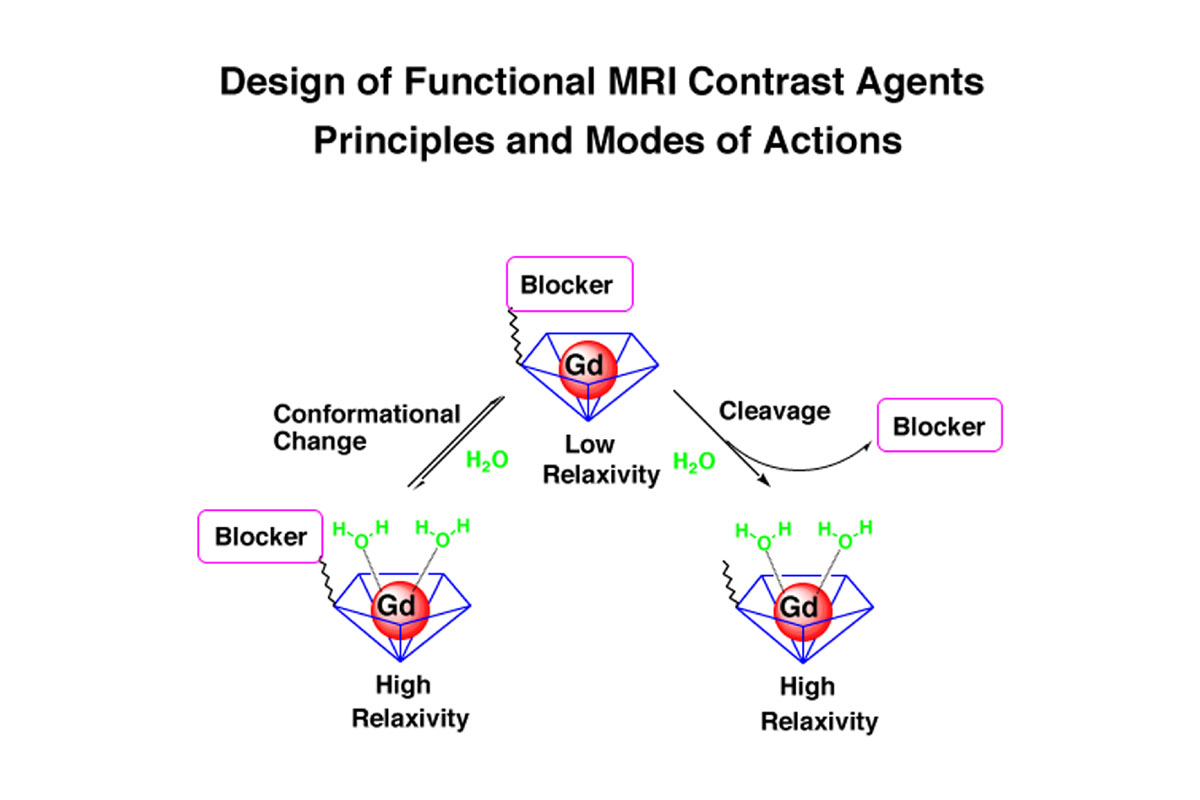
gd_blocking.jpg 93.84 Kb 1200 x 800 |
Design of Functional MRI Contrast Agents |
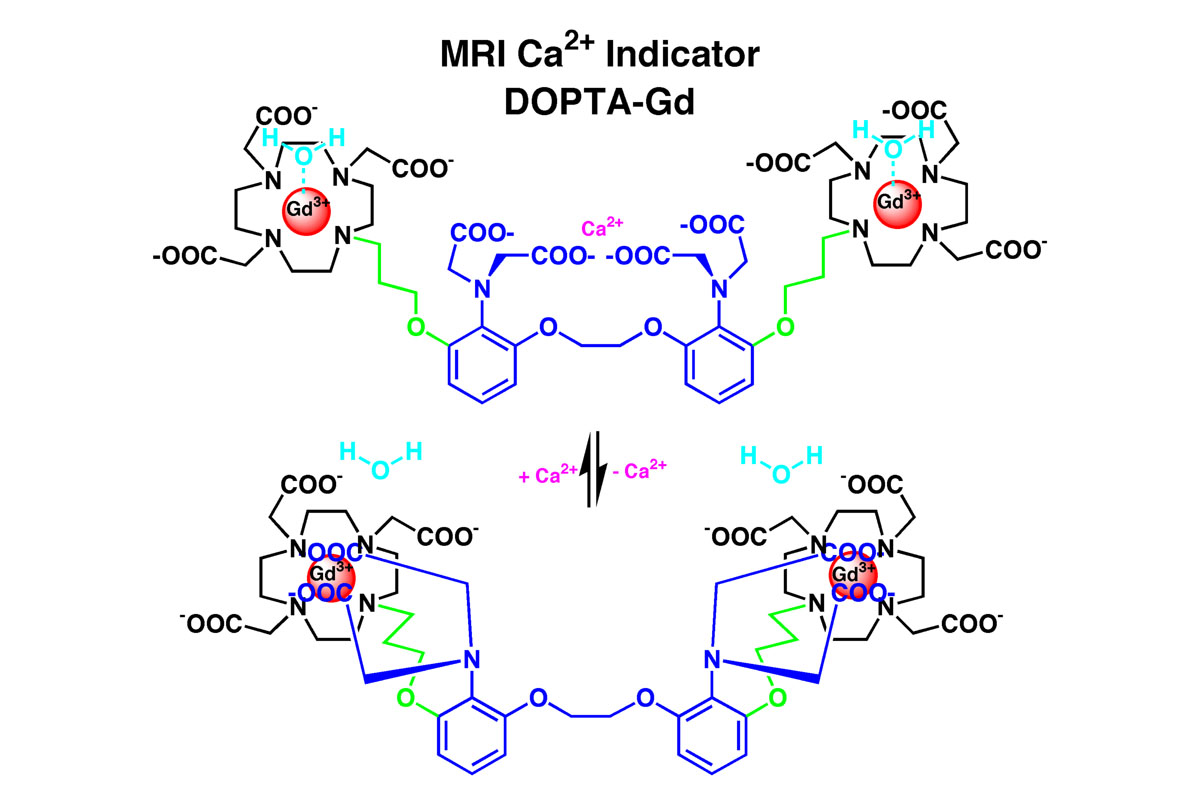
Ca_agent.jpg 93.84 Kb 1200 x 800 |
MRI Ca2+ Indicator |
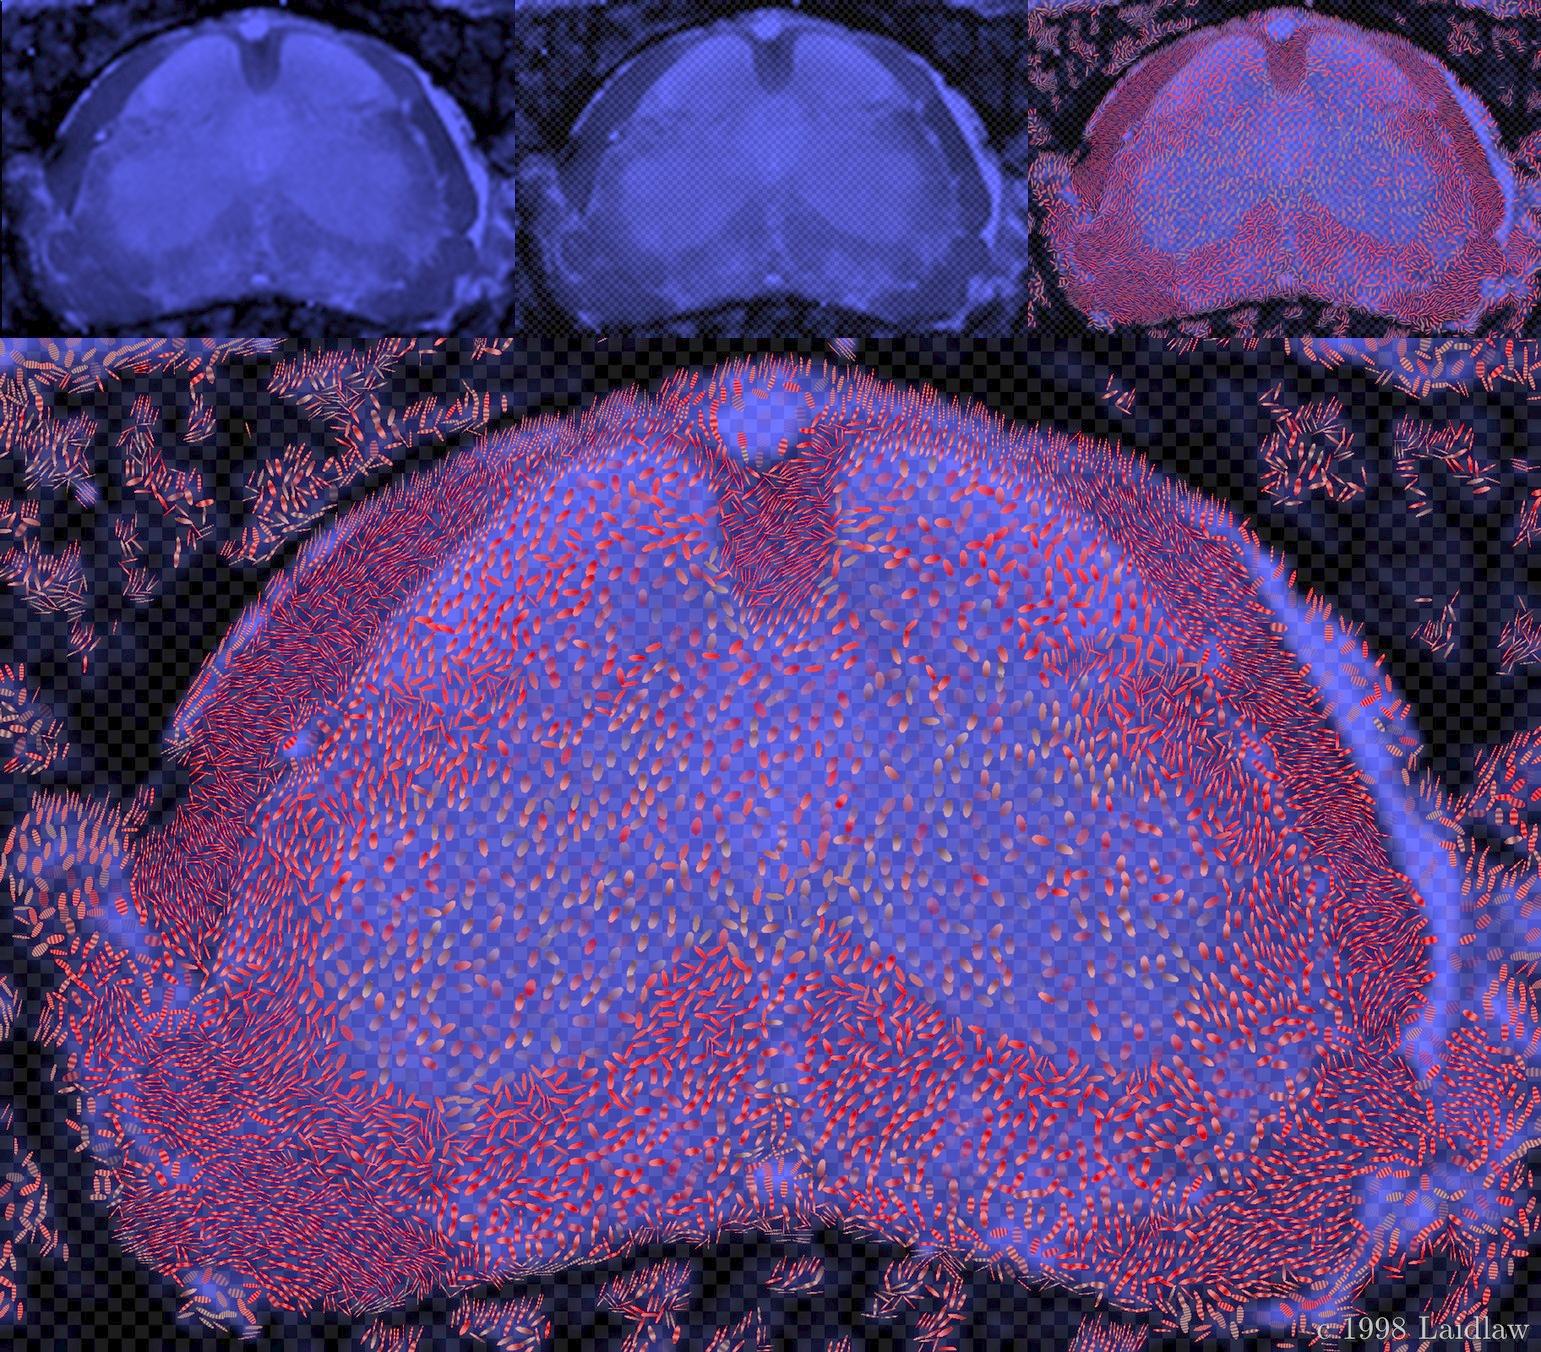
bgeae.jpg 502.10 Kb 1541 x 1352 |
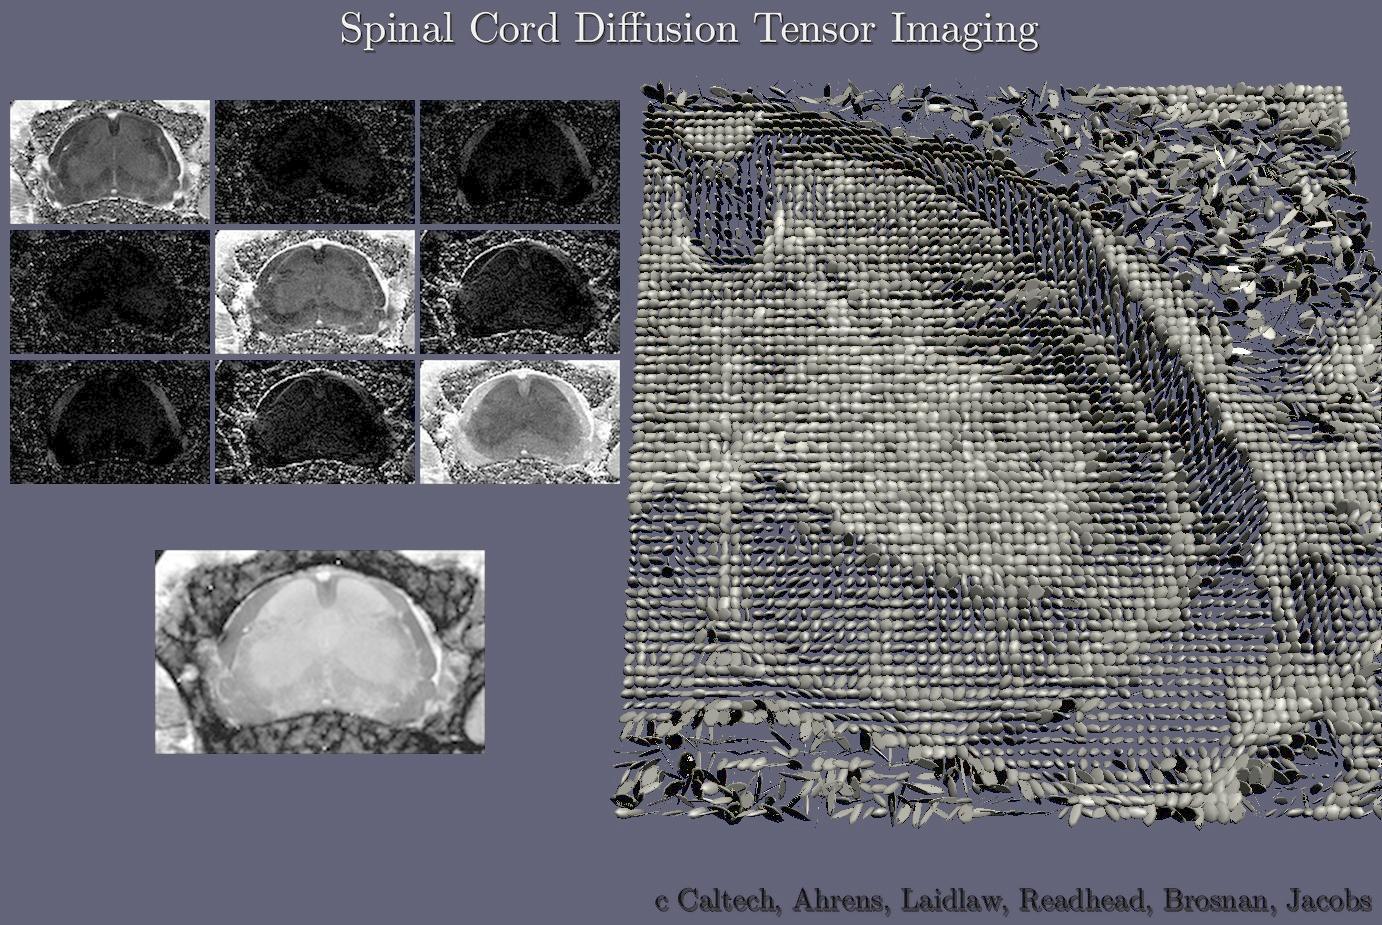
``Mouse Spinal
Cord Diffusion Tensor Visualization using Concepts from Painting,''
David Laidlaw, David Kremers, Eric T. Ahrens, and Matthew J. Avalos, Siggraph Technical Slide Set, 1998. The display of multi-valued data in a single image is challenging. This new technique borrows concepts from painting to effectively display many values simultaneously. This image shows a 2D field of diffusion tensor data, a scalar intensity image, and the underlying sampling rate. The data have seven values at each location in the image, and the relationships among the values are important and difficult to understand otherwise. The image is built up in layers: intensity image (top left); sampling rate grid (top center); ellipse shapes showing in-plane component of principal diffusion and anisotropy (top right); texture on ellipses showing absolute diffusion rate (bottom). Right-left asymmetry in the diffusion tensor information shows regions of pathology in this diseased mouse spinal cord. |
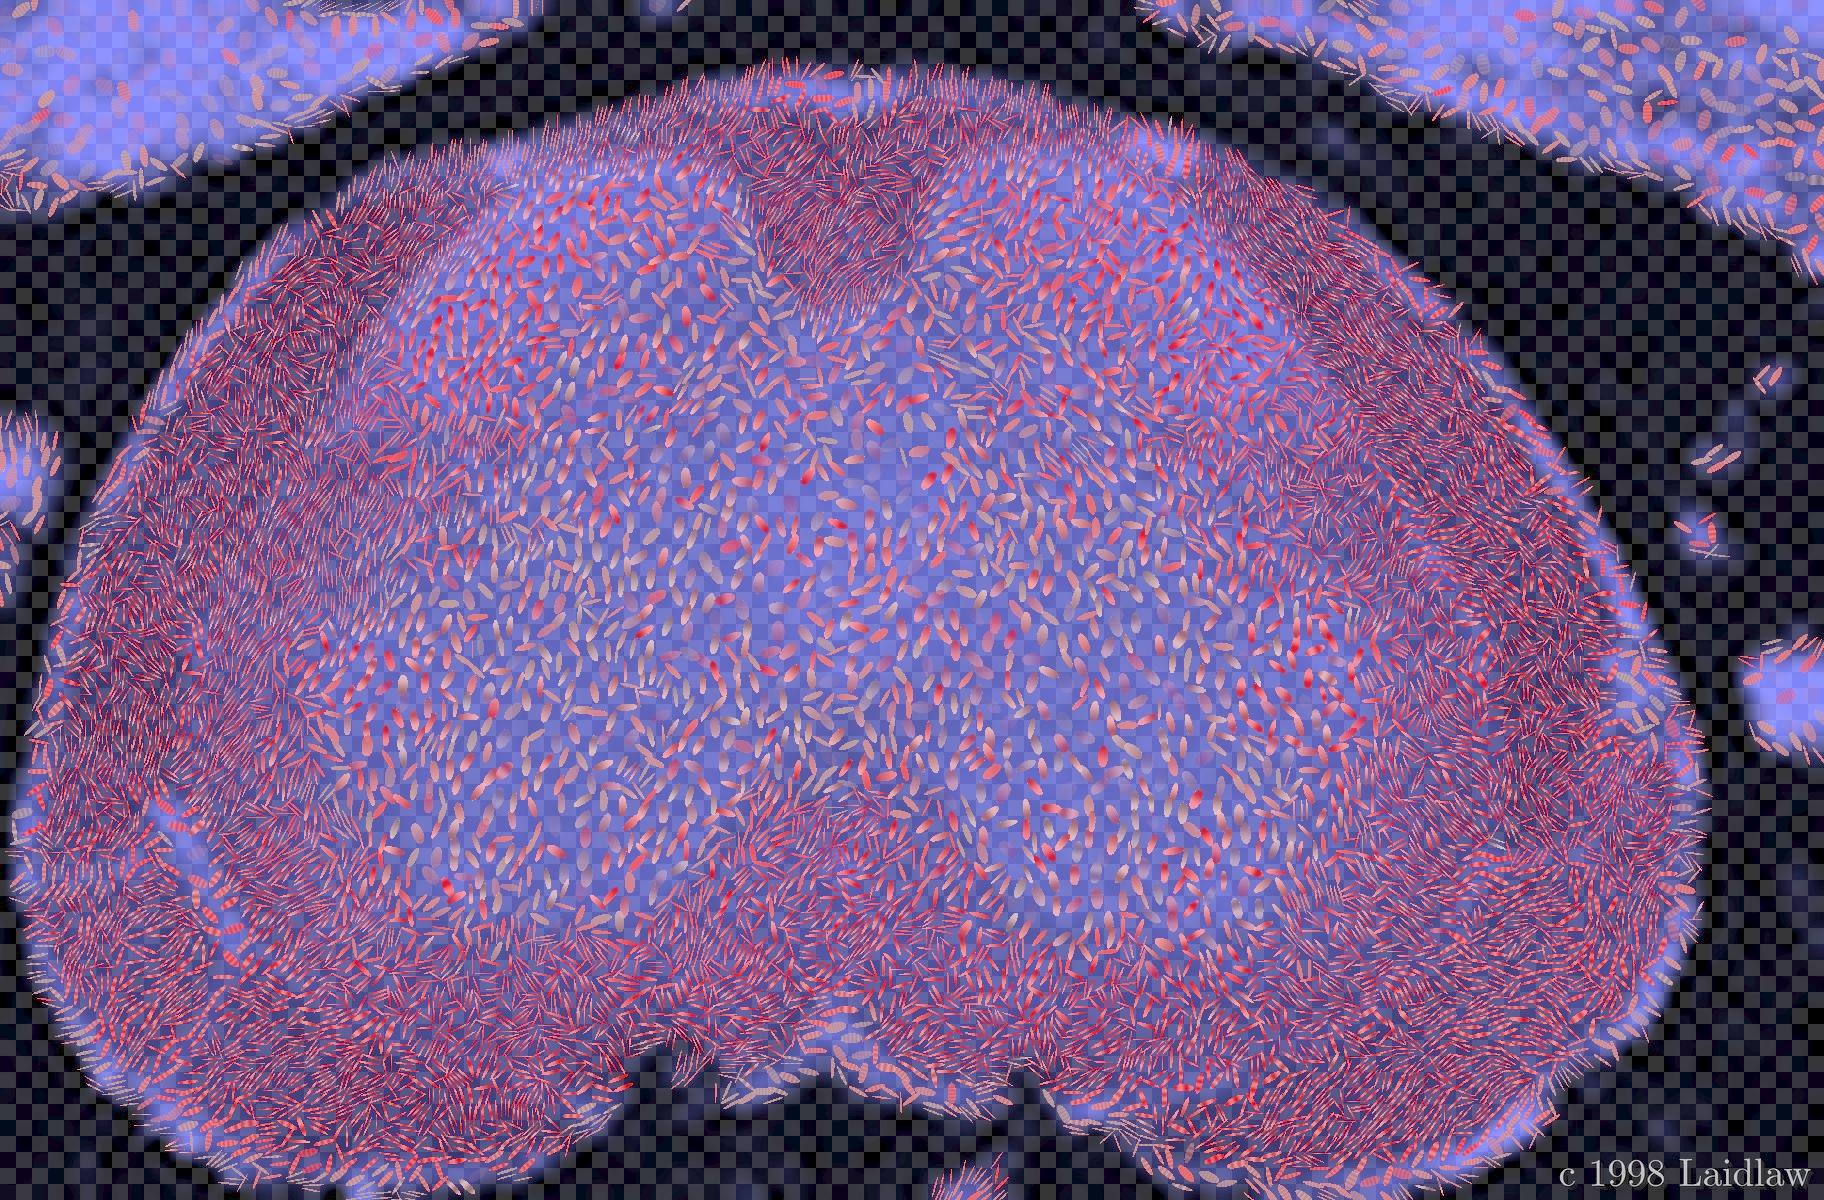
bgctl.jpg 523.83 Kb 1824 x 1200 |
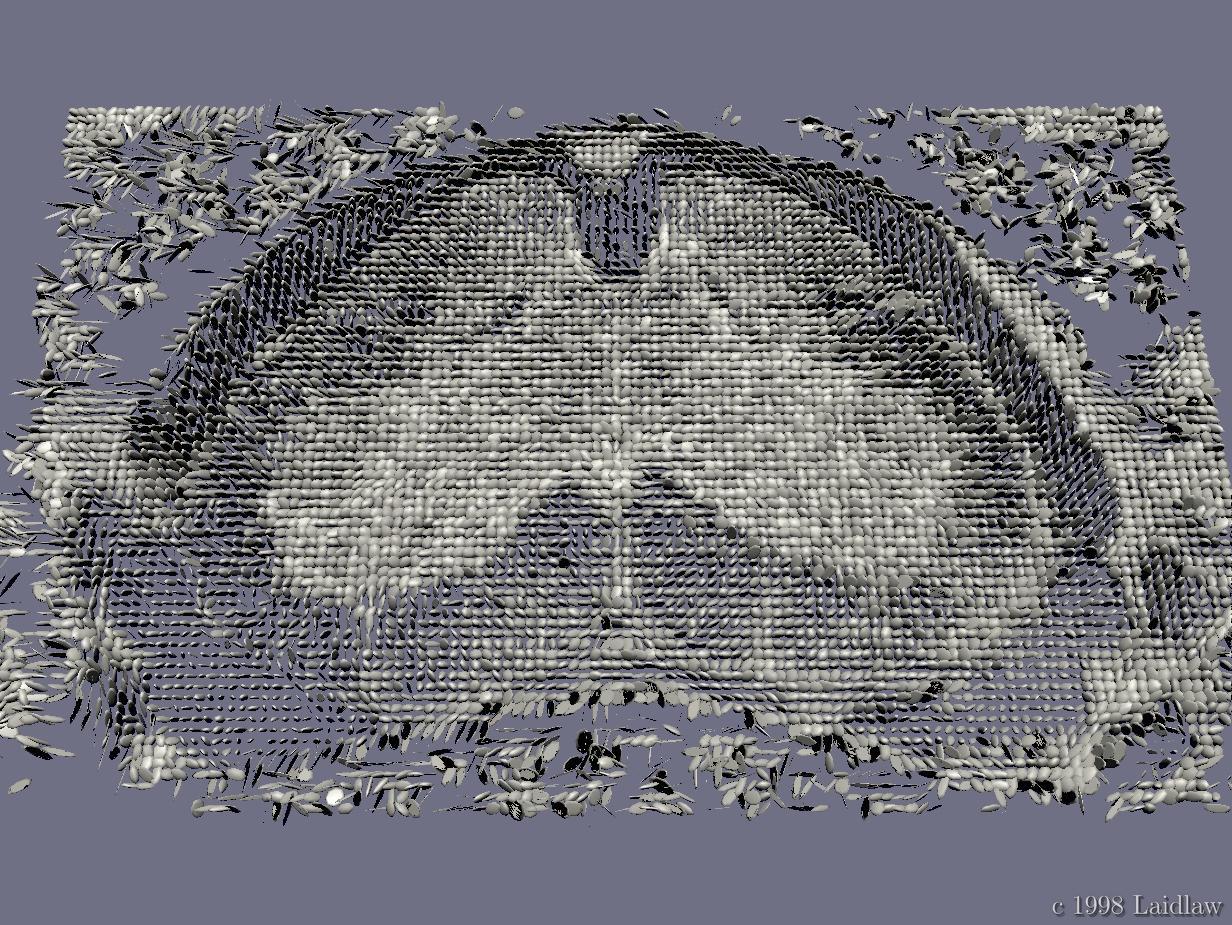
Compare with visualization for a healthy spinal cord. |
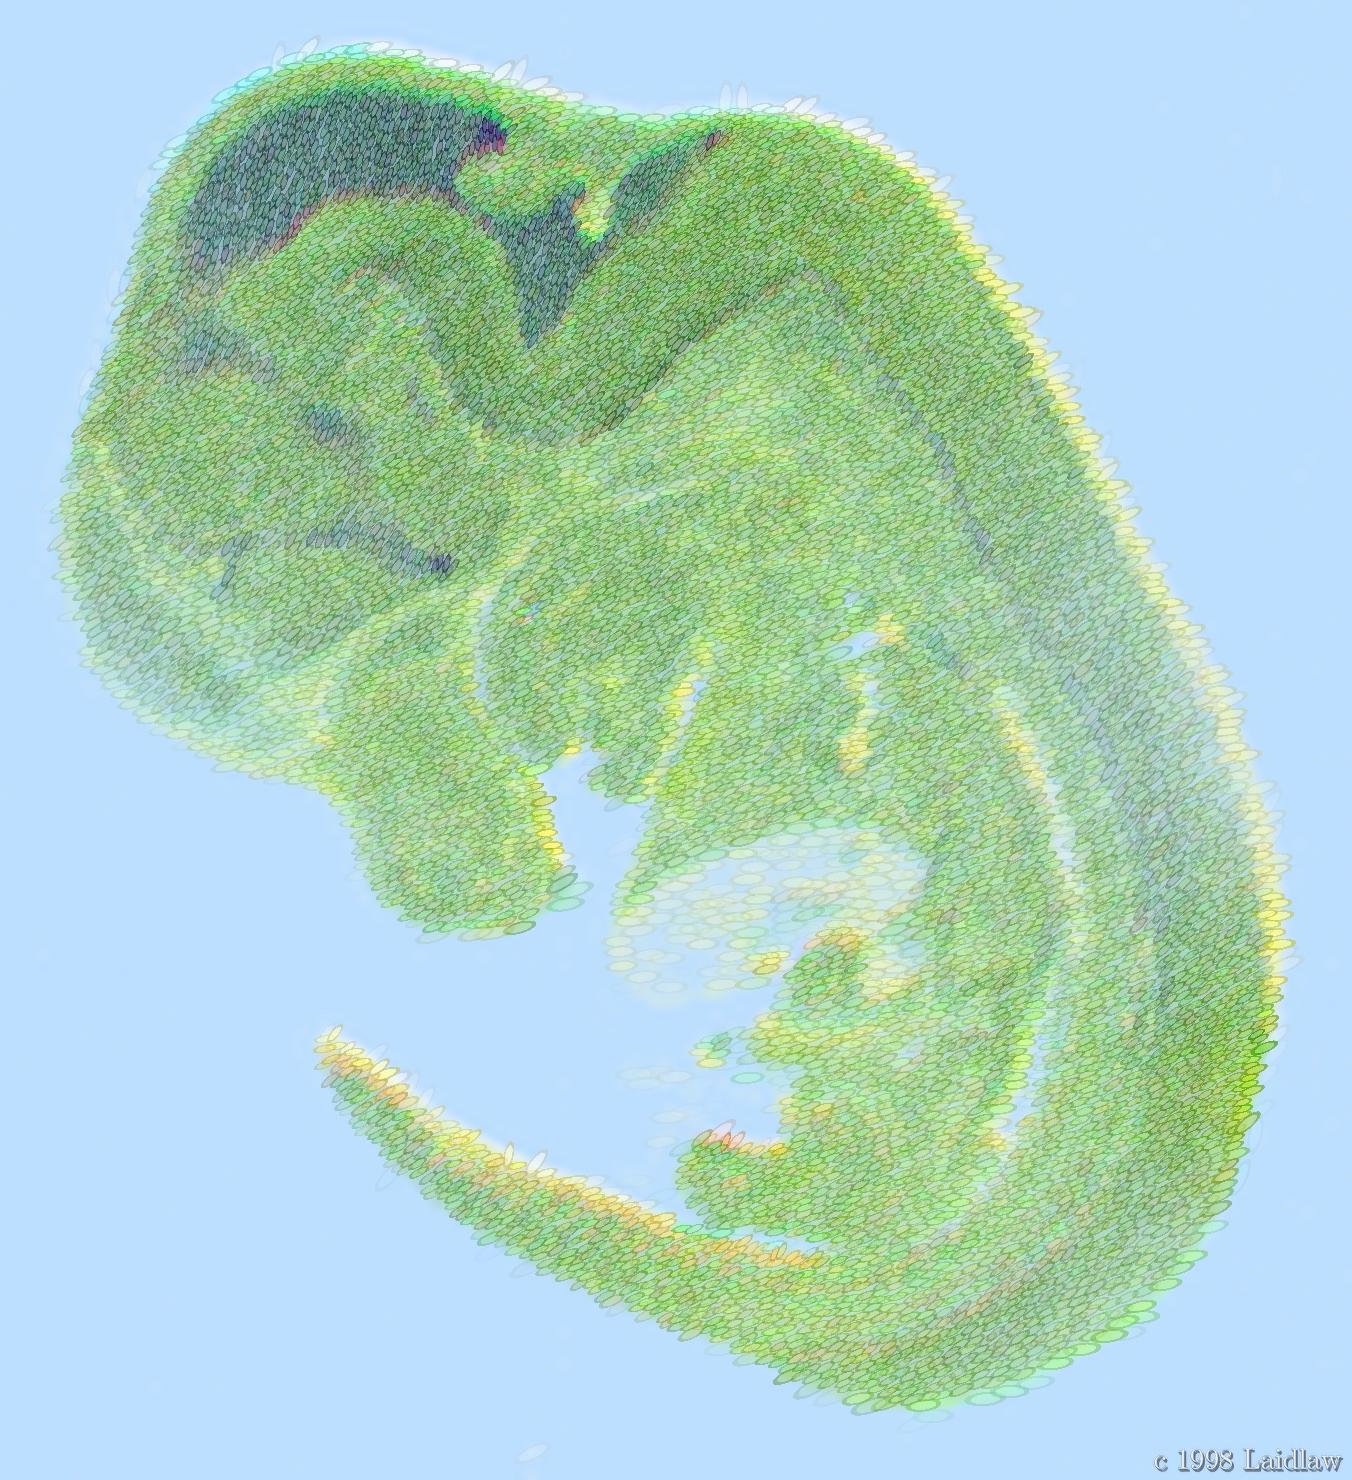
bggreen3.jpg 323.93 Kb 1352 x 1480 |
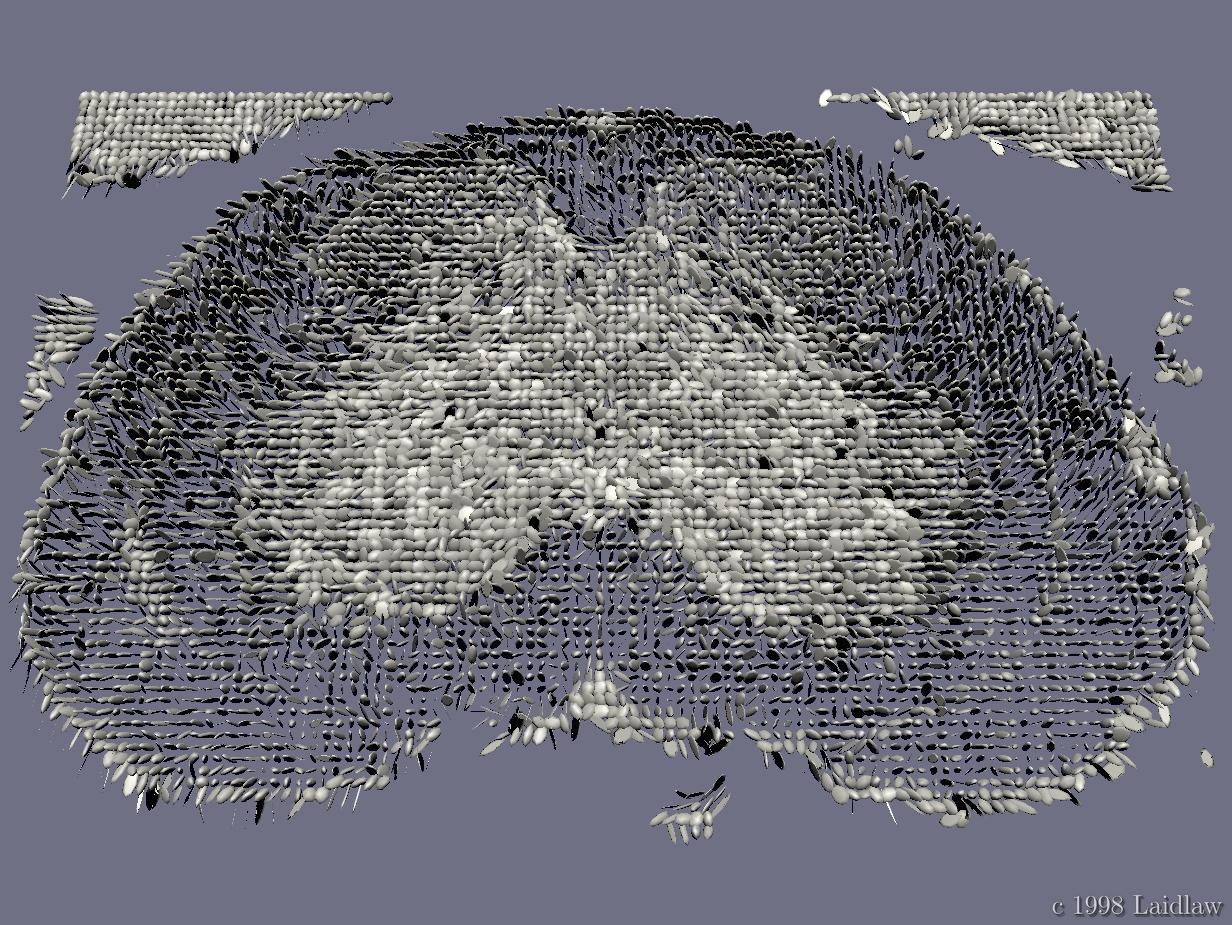
``6-valued
MR Image Data Portrayed with Concepts from Painting,'' w
David Laidlaw, Kremers, Russell E. Jacobs, Eric T. Ahrens, and Matthew J. Avalos, Siggraph Technical Slide Set, 1998. This image simultaneously displays all six values of this 2D magnetic resonance image of a mouse embryo. A viewer can see relationships that would otherwise be difficult to understand. Three of the values are mapped to red, green, and blue. A fourth value maps to opacity, showing the background color where the value is low. A fifth value maps to the size of small pointilist-esque ellipse shapes and a sixth to their direction. |
bgdti.jpg 309.62 Kb 1382 x 925 |
``Second-order Diffusion Tensor Field
Magnetic Resonance Imaging,''
David Laidlaw, Eric T. Ahrens, Carol Readhead, Celia F. Brosnan, and Scott E. Fraser, Siggraph Technical Slide Set, 1997. Slice of mouse spinal cord with MS-like disease. Left: 3x3 array of individual components of matrix representating tensor. Right: tensor ellipsoids reflecting geometric structure within voxels. |
bglentil_eae.jpg 321.39 Kb 1232 x 925 |
Compare full spinal cords section of diseased ... |
bglentil_ctl.jpg 292.58 Kb 1232 x 925 |
and healthy mice. |
bgmousie.jpg 24.11 Kb 640 x 512 |
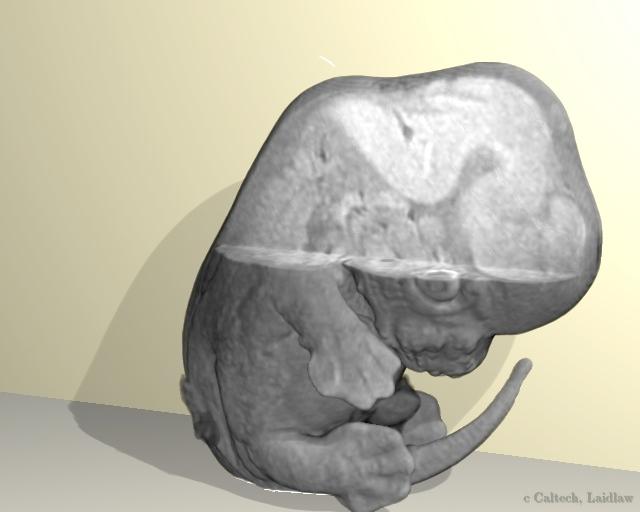
``Goal-directed Linear Combinations
of Multi-Valued Magnetic Resonance Data,''
David Laidlaw, Alan H. Barr and Russell E. Jacobs, Siggraph Technical Slide Set, 1997, Science, 278(5342), 1997. Volume rendering of 6-valued MR data of 12.5 day mouse embryo. Opacity and gray-level linear combinations satisfy mathematical goals: 1) create effective mask, 2) contrast materials well, and 3) keep noise at acceptable level. |
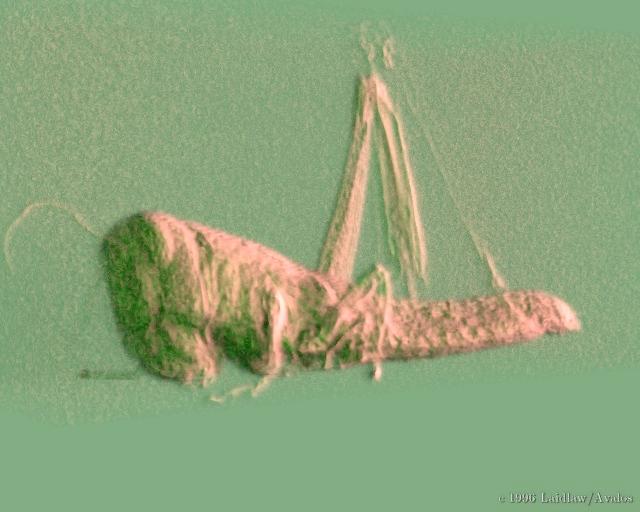
bglocust.jpg 36.76 Kb 640 x 512 |
``Volume Rendered Locust,''
David Laidlaw, Matthew J. Avalos, Siggraph Technical Slide Set, 1996. Semi-transparent volume-rendering of MRI data collected from a locust. |
       |
`Human Molar Geometry Derived From MRI,''
David Laidlaw, Pratik R. Ghosh, Kurt W. Fleischer, Alan H. Barr, and Russell E. Jacobs, Siggraph Technical Slide Set, 1995. |
 |
``Bee MRI Data,''
David Laidlaw, Matthew J. Avalos, Russell E. Jacobs, Kurt W. Fleischer, and Alan H. Barr, Siggraph Technical Slide Set, 1994. |
bghandlayers.jpg 6.32 Kb 320 x 256 |
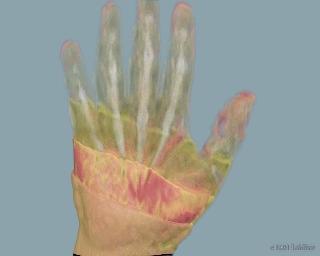
``Inside the Human Hand
2,''
David Laidlaw, Matthew J. Avalos, Russell E. Jacobs, Kurt W. Fleischer, and Alan H. Barr, Siggraph Technical Slide Set, 1994. |
    |
``Lobster MRI Data,''
David Laidlaw, Matthew J. Avalos, Russell E. Jacobs, Kurt W. Fleischer, and Alan H. Barr, Siggraph Technical Slide Set, 1994. |